Something is changing the quality of the air that we breath, and changes the climate condition too. “Almost 99% of the global population breathes unhealthy levels of fine particulate matter and nitrogen dioxide,” says the World Health Organization (WHO).
The goal of the third Sustainable Development Goal (SDG) of Agenda 2030 (signed in September 2015 by the governments of the 193 member countries of the UN) is “ensure healthy lives and promote well-being for all at all ages” and at Target 3.9 we read that “by 2030, substantially reduce the number of deaths and illnesses from hazardous chemicals and air, water and soil pollution and contamination”.
The last report of the World Health Organization (2022) about the impact of environmental situations on health highlights that “ambient (outdoor) and household (indoor) air pollution is environmental risk factors that have been linked to several health conditions, such as they were responsible for approximately 7 million deaths globally in 2016”.
Some 99% of the world population breathes bad levels of fine particulate matter (cause stress to the heart and lung, such as nonfatal heart attacks, irregular heartbeat, aggravated asthma, decreased lung function, increased respiratory symptoms, such as irritation of the airways, coughing or difficulty breathing) and nitrogen dioxide (high levels can interfere with the ability of the blood to carry Oxygen causing headache, fatigue, dizziness, and blue color to the skin and lips, but higher levels can cause trouble breathing, collapse, and even death).
What is air pollution?
Air pollution is the presence in the earth’s atmosphere of physical agents (such as carbonaceous), chemicals (such as hydrocarbons), and biological pollutants (such as anthrax) which modify the natural atmospheric characteristics causing a harmful effect on beings living and the environment.
These are pollutants that usually are not present in the normal composition of the air, or are, but at a lower concentration level. Particularly, the growth of carbon dioxide is the main responsible for climate change.

About 6,000 cities in 117 countries now monitor air quality. Data are showing that LMI people countries suffer the highest exposures to outdoor air pollution at levels exceeding WHO air quality limits.
Particulate matter, especially PM2.5, is able to penetrate deep into the lungs and enter the bloodstream, which can cardiovascular, cerebrovascular (stroke), and respiratory causes complications.
Nitrogen dioxide is associated with respiratory tract diseases, especially asthma, which can lead to breathing problems and symptoms (such as coughing, wheezing, or difficulty breathing) requiring hospitalization or emergency care.
In Europe, for instance, in 2020 premature deaths from chronic exposure to fine particulate matter were estimated at 275,000, 64,000 from chronic nitrogen dioxide exposure, and 28,000 from acute ozone exposure.
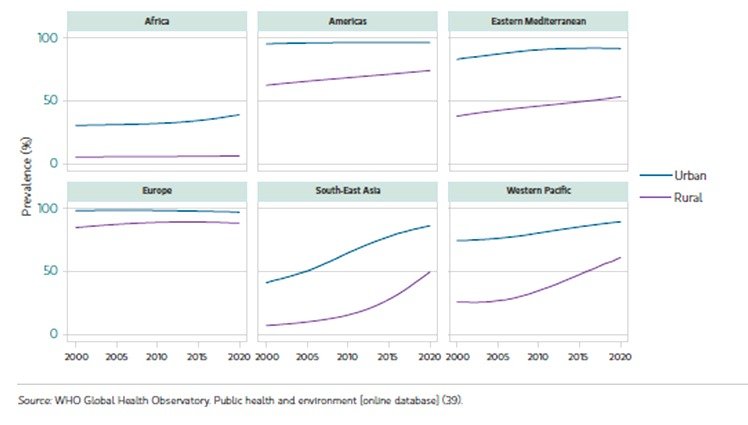
Regarding household (indoor) air pollution, the situation is represented by the following picture where we can understand the great gap between the lower-income countries (LIC) and the high-income countries (HIC), as well as that between the situation in urban and rural centers.
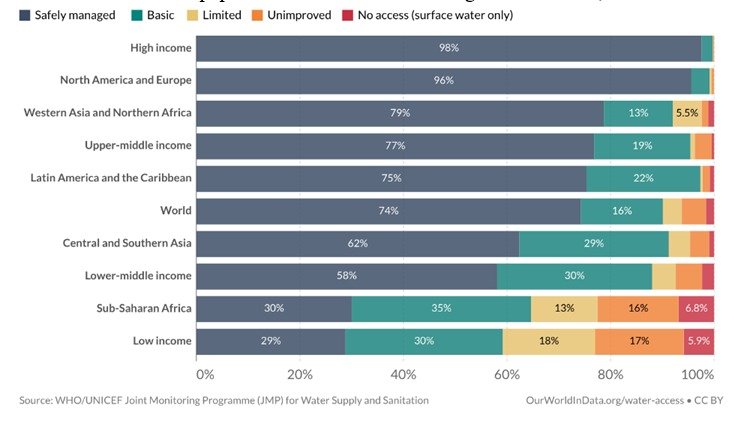
Something similar we meet in the availability of clean water, a basic element to ensure acceptable conditions of personal hygiene and food safety, as can be understood by the following picture.
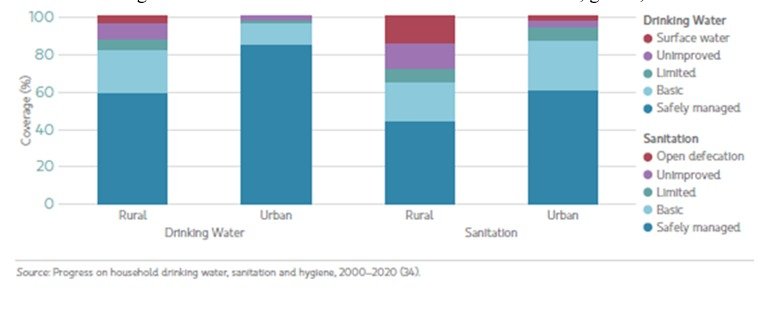
And regarding the difference between urban and rural areas:
In the WHO Report, some pages are dedicated to the relationship between environmental conditions and human health; so we discover that all the environmental risks derive from the mismanagement of every kind of waste: liquid, solid, and gaseous.
Greenhouse gases are produced by factories, processing plants, vehicles, agriculture, and human activities by a not-electric device; liquid waste results again from processing plants, that spread them without precautions, and so polluting the soil and water bodies; solid waste, perhaps dangerous or toxic, are burned or buried, in lack of correct management.
According to a study by the World Bank Group, global waste generation in 2020 reached 2.24 billion tons, and growth to 3.88 billion tons is estimated in 2050.
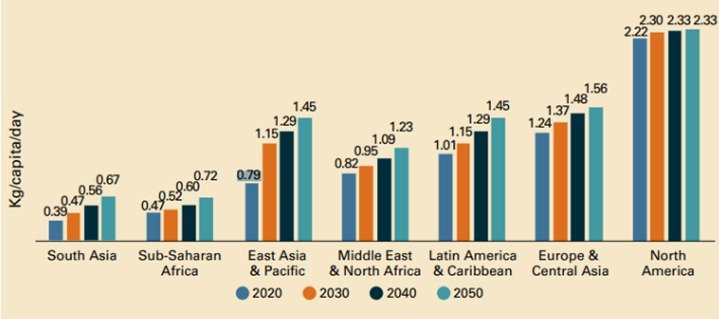
Globally, most waste is currently dumped or disposed of in some form of a landfill. Around 37% of waste is disposed of in some form of a landfill, but only 8% of it is disposed of in sanitary landfills with gas collection systems.
Open dumping accounts for about 31% of waste, 19% is recovered materials through recycling and composting, and 11% is incinerated for final disposal. Adequate waste disposal or treatment is almost exclusively the domain of high- and upper-middle-income countries.
Lower-income countries generally rely on open dumping; 93% of waste is dumped in low-income countries and only 2% in high-income countries.
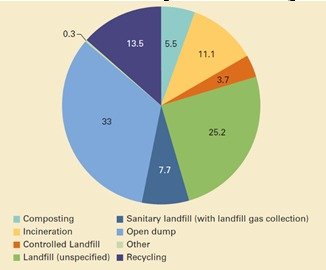
Based on the volume of waste generated, its composition, and how it is managed, it is estimated that 1.6 billion tonnes of carbon dioxide (CO2) equivalent greenhouse gas emissions were generated from solid waste treatment and disposal in 2016, or 5 percent of global emissions.
This is driven primarily by disposing of waste in open dumps and landfills without landfill gas collection systems. Food waste accounts for nearly 50% of emissions.
But what produces this situation?
According to the Report “Trends in Solid Waste Management” by the World Bank Group “Financing solid waste management systems is a significant challenge, even more so for ongoing operational costs than for capital investments, and operational costs need to be taken into account upfront.
In high-income countries, operating costs for integrated waste management, including collection, transport, treatment, and disposal, generally exceed $100 per tonne.
Lower-income countries spend less on waste operations in absolute terms, with costs of about $35 per tonne and sometimes higher, but these countries experience much more difficulty in recovering costs.
Waste management is labor intensive and costs of transportation alone are in the range of $20–$50 per tonne. Cost recovery for waste services differs drastically across income levels.
User fees range from an average of $35 per year in low-income countries to $170 per year in high-income countries, with full or nearly full cost recovery being largely limited to high-income countries.
User fee models may be fixed or variable based on the type of user being billed. Typically, local governments cover about 50 percent of investment costs for waste systems, and the remainder comes mainly from national government subsidies and the private sector”.
These costs are to manage an integrated system, in order to preserve pollution of soil and water bodies (if waste is spread on the earth without protection), and also of air if buried, all causes of attaches to human health, the costs of which are difficult to quantify for deaths, illnesses and the functioning of public health.
According to the “WASTE MANAGEMENT IN PAKISTAN”, ( Report on waste management that is part of the technical support on waste and plastics provided to the Ministry of Climate Change, Pakistan, Government of Pakistan through the SWITCH-Asia SCP Facility, by Dr. Saima Shafique & Tom Clark in 2022) “at present, Pakistan generates 48.5 million tonnes of solid waste annually, with megacities such as Karachi and Lahore contributing to the bulk of this figure.
On average, nationwide waste generation ranges from 0.24 to 0.65 Kg/per capita/day, and this has been growing at a rate of 2.4% annually.
There is a lack of plants for the recovery of materials from waste, so much so that a large part of municipal waste is burned or discharged outdoors, with serious pollution of the air and soil.
Karachi, Pakistan’s largest city, holds the dubious record of having the poorest waste management facilities in the country, and people are very concerned about their health.
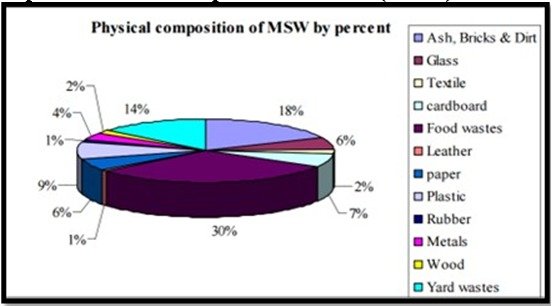
It is a frequent misconception that technology is the solution to the problem of unmanaged and increasing waste. Technology is not a panacea and is usually the only one factor to consider when managing solid waste.
Countries that advance from open dumping and other rudimentary waste management methods are more likely to succeed when they select locally appropriate solutions.
For instance – and without spending so much money – the first goal can be reached through the involvement of every actor: policymakers, operators, and citizens, organizing the collection activities, in order to materials are divided and it’s easier to direct to the processing industries.
Regarding the organic fraction, should realize plants to produce compost and electricity. This should be the first step in the right direction toward integrated waste management.
To do it, every country has to start with plans of training people with new skills requested, useful for managing all these activities.
The Diplomatic Insight is a digital and print magazine focusing on diplomacy, defense, and development publishing since 2009.


